#include <GammaEfficiencyAnalysis.h>
Public Member Functions | |
| GammaEfficiencyAnalysis () | |
| void | setVerbosity (int a_verbosity) |
| void | loadExperimentalSpectra (string a_fileName, string a_isotope, double a_countTime=1, double a_activity=1, int a_numLines=5) |
| load calibrated experimental spectra More... | |
| void | useTFIntDiffCorrection (bool a_useCorr) |
| void | loadBackgroundSpectra (string a_fileName, double a_countTime) |
| int | addSimulatedData (string a_fileName, int a_numSimEvents) |
| void | setSimHistNumBins (int a_bins) |
| set number of bins for simulated hists More... | |
| void | setSimHistMaxE (double a_maxEnergy) |
| void | processSimulatedData (string a_configFileName, bool a_resampleEffCorr=false, double a_acceptanceWindow=2.5e-3) |
| TH1F * | getSimHist (DetType a_detType, int a_detID, int a_elemID=0, bool a_addBack=false) |
| returns simulated histogram (if it exists) More... | |
| double | getSimEff (double a_gammaEnergy, DetType a_detType, int a_detID, int a_elemID=0, bool a_addBack=false) |
| void | fitTriggerProb (string a_fileNameHighTF, string a_fileNameLowTF, double a_countTimeHigh, double a_countTimeLow, string a_fileNameBKG="", double a_countTimeBKG=-1, string a_isotope="Eu152", int a_numLines=16) |
| double | calcTriggerProb (DetType a_detType, int a_detID, int a_elemID, double a_energy) |
| calculate the trigger probability for a given detector at an energy More... | |
| void | generateNewTriggerProbs () |
| void | computeAllExpEffs (bool a_drawFits=false) |
| void | drawEffPeakFits (DetType a_detType, int a_detID, int a_elemID=0, bool a_addBack=false) |
| vector< vector< double > > | getExpEffs (DetType a_detType, int a_detID, int a_elemID=0, bool a_addBack=false) |
| map< int, vector< vector< double > > > | calcAddBackFactors () |
| void | plotAddBackSimExpComp () |
| plots simulated and experimental add back factors More... | |
| void | plotSimExpComp (DetType a_detType, int a_detID, int a_elemID=0, bool a_addBack=false) |
| plot simulated and experimental efficiency + percent difference More... | |
| map< double, PeakInfo > | fitIsotopePeaks (TH1 *a_hist, string a_isotope, double a_activity, double a_countTime, int a_numLines, bool a_draw=false) |
| map< double, std::pair< double, double > > | calcEfficiency (TH1 *a_hist, string a_isotope, double a_activity, double a_countTime, int a_numLines, vector< PeakInfo > &a_peakFits) |
| map< double, std::pair< double, double > > | calcEfficiency (string a_isotope, double a_activity, double a_countTime, int a_numLines, vector< PeakInfo > &a_peakFits) |
| map< double, std::pair< double, double > > | calcEfficiency (map< double, PeakInfo > a_peakFits, string a_isotope, double a_activity, double a_countTime, int a_numLines) |
| void | setNewPeakFit (PeakInfo a_peakInfo, DetType a_detType, int a_detID, int a_elemID=0, bool a_addBack=false) |
| vector< PeakInfo > | getPeakFits (DetType a_detType, int a_detID, int a_elemID=0, bool a_addBack=false) |
| GammaEfficiencyAnalysis () | |
| void | addExperimentalSpectra (string a_fileName, double a_countTime, string a_location) |
| void | useTFIntDiffCorrection (bool a_useCorr) |
| void | addBackgroundSpecrta (string a_fileName, double a_countTime) |
| void | addSimulatedSpectra (string a_fileName, string a_location, string a_dlParams) |
| map< int, vector< double > > | calcCorrectionCurve (bool a_fitSaturation=0, int a_draw=-1) |
| void | calcAddBack (int a_clover, string a_dl, string a_loc) |
| compare simulated and experimental addback factor curves More... | |
| void | calcAddBack (vector< string > a_loc) |
| plot experimental add-back factor for both clovers More... | |
| map< double, vector< double > > | uniEffComp (int a_channel, string a_dl="p0", string a_loc="center2", bool a_draw=0) |
| plot simulated and experimental efficiency + percent difference More... | |
| void | plotChannelLoc (int a_channel, vector< string > a_locs, string a_dl="20_i07p5_i17_h22") |
| plot simulated and experimental efficiency for the 3 locations More... | |
| void | plotExpCloverEff (int a_clover, vector< string > a_locs={"center","clover","scint"}) |
| void | plotExpCloverEff (string a_loc) |
| plot both clovers experimental Eu152 efficiency for a location More... | |
| void | plotExpCloverEff () |
| plot all 3 source locs for both clovers More... | |
Public Attributes | |
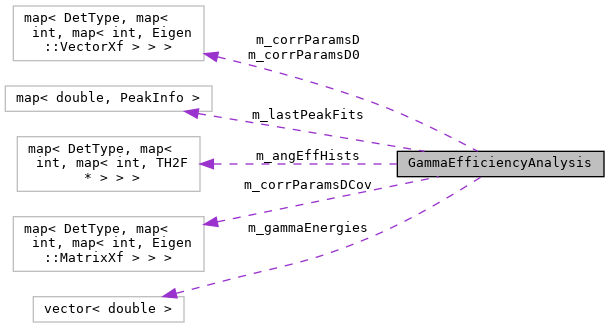
| map< double, PeakInfo > | m_lastPeakFits |
| vector< double > | m_gammaEnergies |
| map< DetType, map< int, map< int, Eigen::VectorXf > > > | m_corrParamsD0 |
| map< DetType, map< int, map< int, Eigen::MatrixXf > > > | m_corrParamsDCov |
| map< DetType, map< int, map< int, Eigen::VectorXf > > > | m_corrParamsD |
| map< DetType, map< int, map< int, TH2F * > > > | m_angEffHists |
Detailed Description
class to analyze Gamma Efficiency data and facilitate comparisons with processed GEANT4 data J. Gordon 2020
class to analyze Gamma Efficiency (Eu-152) data and facilitate comparisons with processed GEANT4 data J. Gordon 2020
Constructor & Destructor Documentation
◆ GammaEfficiencyAnalysis() [1/2]
| GammaEfficiencyAnalysis::GammaEfficiencyAnalysis | ( | ) |

◆ GammaEfficiencyAnalysis() [2/2]
| GammaEfficiencyAnalysis::GammaEfficiencyAnalysis | ( | ) |
Member Function Documentation
◆ addBackgroundSpecrta()
| void GammaEfficiencyAnalysis::addBackgroundSpecrta | ( | string | a_fileName, |
| double | a_countTime | ||
| ) |
◆ addExperimentalSpectra()
| void GammaEfficiencyAnalysis::addExperimentalSpectra | ( | string | a_fileName, |
| double | a_countTime, | ||
| string | a_location | ||
| ) |
load calibrated experimental spectra set a_location to "lowTF" or "highTF" for TF-int/diff correction spectra
◆ addSimulatedData()
| int GammaEfficiencyAnalysis::addSimulatedData | ( | string | a_fileName, |
| int | a_numSimEvents | ||
| ) |
load simulated spectra (for simulations with uniform spectra) post-processed with "generateSpectrumVeto"
◆ addSimulatedSpectra()
| void GammaEfficiencyAnalysis::addSimulatedSpectra | ( | string | a_fileName, |
| string | a_location, | ||
| string | a_dlParams | ||
| ) |
load simulated spectra (for simulations with uniform spectra) post-processed with "generateSpectrumVeto"
◆ calcAddBack() [1/2]
| void GammaEfficiencyAnalysis::calcAddBack | ( | int | a_clover, |
| string | a_dl, | ||
| string | a_loc | ||
| ) |
compare simulated and experimental addback factor curves
load experimenta; data and calculate peak areas
compute the add-back factor
load the simulated spectra
average simulated data over 4 bins
calculate percent difference to nearest simulated data point should probably fit the experimental data and take difference

◆ calcAddBack() [2/2]
| void GammaEfficiencyAnalysis::calcAddBack | ( | vector< string > | a_loc | ) |
plot experimental add-back factor for both clovers
load experimenta; data and calculate peak areas
compute the add-back factor

◆ calcAddBackFactors()
| map< int, vector< vector< double > > > GammaEfficiencyAnalysis::calcAddBackFactors | ( | ) |
calculate experimental add back factors for all CLOVERs <clover ID, <energies, add back factors, uncertainty>>


◆ calcCorrectionCurve()
| map< int, vector< double > > GammaEfficiencyAnalysis::calcCorrectionCurve | ( | bool | a_fitSaturation = 0, |
| int | a_draw = -1 |
||
| ) |
find fit parameters for trigger probability correction set a_draw to channel number to draw the data + fit
load the data
compute curves for each leaf
get the peak areas
compute peak area ratios
let saturation be free parameter
do the fit


◆ calcEfficiency() [1/3]
| map< double, std::pair< double, double > > GammaEfficiencyAnalysis::calcEfficiency | ( | map< double, PeakInfo > | a_peakFits, |
| string | a_isotope, | ||
| double | a_activity, | ||
| double | a_countTime, | ||
| int | a_numLines | ||
| ) |
- Parameters
-
a_activity e.g. "Eu152" a_countTime in Bq a_numLines in seconds number of lines to fit, i.e. 20 strongest lines
◆ calcEfficiency() [2/3]
| map< double, std::pair< double, double > > GammaEfficiencyAnalysis::calcEfficiency | ( | string | a_isotope, |
| double | a_activity, | ||
| double | a_countTime, | ||
| int | a_numLines, | ||
| vector< PeakInfo > & | a_peakFits | ||
| ) |
- Parameters
-
a_activity e.g. "Eu152" a_countTime in Bq a_numLines in seconds a_peakFits number of lines to fit, i.e. 20 strongest lines

◆ calcEfficiency() [3/3]
| map< double, std::pair< double, double > > GammaEfficiencyAnalysis::calcEfficiency | ( | TH1 * | a_hist, |
| string | a_isotope, | ||
| double | a_activity, | ||
| double | a_countTime, | ||
| int | a_numLines, | ||
| vector< PeakInfo > & | a_peakFits | ||
| ) |
- Parameters
-
a_activity e.g. "Eu152" a_countTime in Bq a_numLines in seconds a_peakFits number of lines to fit, i.e. 20 strongest lines


◆ calcTriggerProb()
| double GammaEfficiencyAnalysis::calcTriggerProb | ( | DetType | a_detType, |
| int | a_detID, | ||
| int | a_elemID, | ||
| double | a_energy | ||
| ) |
calculate the trigger probability for a given detector at an energy

◆ computeAllExpEffs()
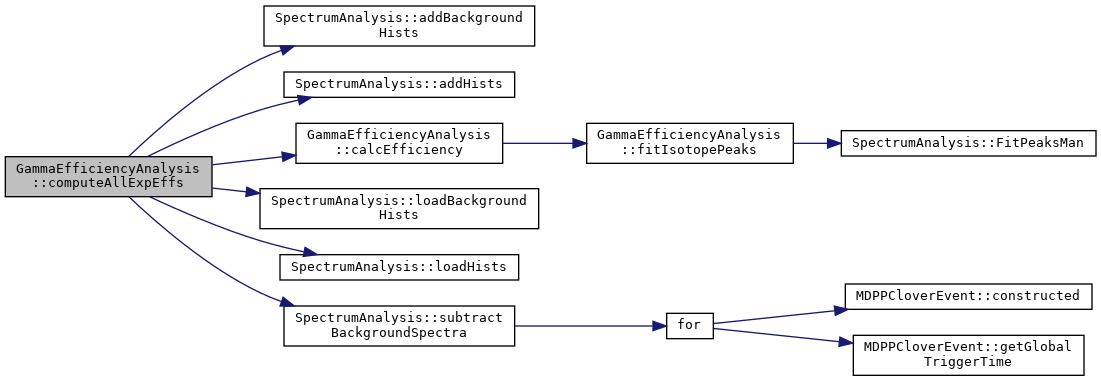
| void GammaEfficiencyAnalysis::computeAllExpEffs | ( | bool | a_drawFits = false | ) |
calculate efficiency from all experimental datasets loaded stored in m_allExpEffs
load experimental data and calculate peak areas

◆ drawEffPeakFits()
| void GammaEfficiencyAnalysis::drawEffPeakFits | ( | DetType | a_detType, |
| int | a_detID, | ||
| int | a_elemID = 0, |
||
| bool | a_addBack = false |
||
| ) |
◆ fitIsotopePeaks()
| map< double, PeakInfo > GammaEfficiencyAnalysis::fitIsotopePeaks | ( | TH1 * | a_hist, |
| string | a_isotope, | ||
| double | a_activity, | ||
| double | a_countTime, | ||
| int | a_numLines, | ||
| bool | a_draw = false |
||
| ) |
- Parameters
-
a_activity e.g. "Eu152" a_countTime in Bq a_numLines in seconds a_draw number of lines to fit, i.e. 20 strongest lines


◆ fitTriggerProb()
| void GammaEfficiencyAnalysis::fitTriggerProb | ( | string | a_fileNameHighTF, |
| string | a_fileNameLowTF, | ||
| double | a_countTimeHigh, | ||
| double | a_countTimeLow, | ||
| string | a_fileNameBKG = "", |
||
| double | a_countTimeBKG = -1, |
||
| string | a_isotope = "Eu152", |
||
| int | a_numLines = 16 |
||
| ) |
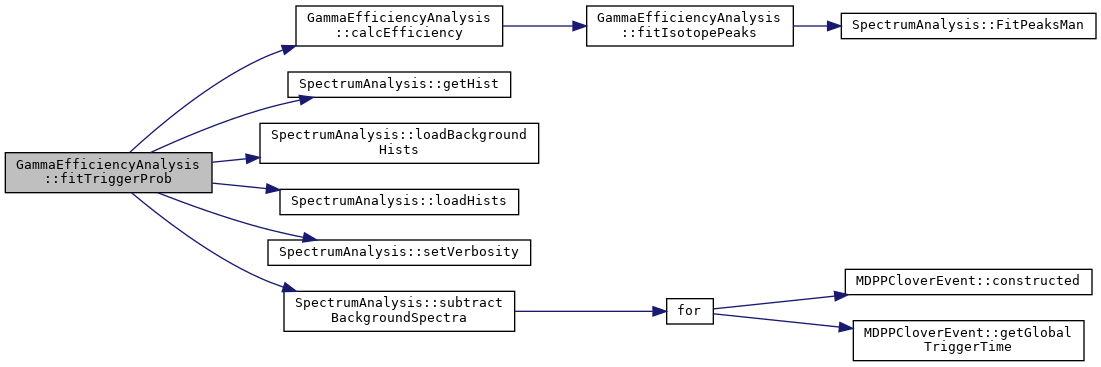
find fit parameters for trigger probability correction set m_verbosity=2 to draw the fit
load the data
compute curves for each leaf
get the peak areas
compute peak area ratios
do the fit
◆ generateNewTriggerProbs()
| void GammaEfficiencyAnalysis::generateNewTriggerProbs | ( | ) |
generates new parameters for trigger probability fit based on covariance does this for all detectors


◆ getExpEffs()
| vector< vector< double > > GammaEfficiencyAnalysis::getExpEffs | ( | DetType | a_detType, |
| int | a_detID, | ||
| int | a_elemID = 0, |
||
| bool | a_addBack = false |
||
| ) |

◆ getPeakFits()
| vector< PeakInfo > GammaEfficiencyAnalysis::getPeakFits | ( | DetType | a_detType, |
| int | a_detID, | ||
| int | a_elemID = 0, |
||
| bool | a_addBack = false |
||
| ) |

◆ getSimEff()
| double GammaEfficiencyAnalysis::getSimEff | ( | double | a_gammaEnergy, |
| DetType | a_detType, | ||
| int | a_detID, | ||
| int | a_elemID = 0, |
||
| bool | a_addBack = false |
||
| ) |

◆ getSimHist()
| TH1F * GammaEfficiencyAnalysis::getSimHist | ( | DetType | a_detType, |
| int | a_detID, | ||
| int | a_elemID = 0, |
||
| bool | a_addBack = false |
||
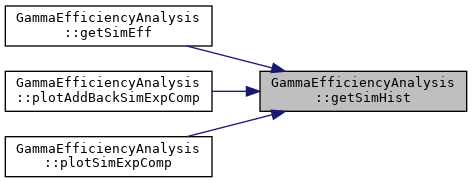
| ) |
returns simulated histogram (if it exists)
◆ loadBackgroundSpectra()
| void GammaEfficiencyAnalysis::loadBackgroundSpectra | ( | string | a_fileName, |
| double | a_countTime | ||
| ) |
◆ loadExperimentalSpectra()
| void GammaEfficiencyAnalysis::loadExperimentalSpectra | ( | string | a_fileName, |
| string | a_isotope, | ||
| double | a_countTime = 1, |
||
| double | a_activity = 1, |
||
| int | a_numLines = 5 |
||
| ) |
load calibrated experimental spectra
◆ plotAddBackSimExpComp()
| void GammaEfficiencyAnalysis::plotAddBackSimExpComp | ( | ) |
plots simulated and experimental add back factors

◆ plotChannelLoc()
| void GammaEfficiencyAnalysis::plotChannelLoc | ( | int | a_channel, |
| vector< string > | a_locs, | ||
| string | a_dl = "20_i07p5_i17_h22" |
||
| ) |
plot simulated and experimental efficiency for the 3 locations

◆ plotExpCloverEff() [1/3]
| void GammaEfficiencyAnalysis::plotExpCloverEff | ( | ) |
plot all 3 source locs for both clovers
load experimenta; data and calculate peak areas

◆ plotExpCloverEff() [2/3]
| void GammaEfficiencyAnalysis::plotExpCloverEff | ( | int | a_clover, |
| vector< string > | a_locs = {"center","clover","scint"} |
||
| ) |
plot experimental Eu152 efficiency for the 3 standard source locations {center,clover,scint} for a clover
load experimenta; data and calculate peak areas

◆ plotExpCloverEff() [3/3]
| void GammaEfficiencyAnalysis::plotExpCloverEff | ( | string | a_loc | ) |
plot both clovers experimental Eu152 efficiency for a location
load experimenta; data and calculate peak areas

◆ plotSimExpComp()
| void GammaEfficiencyAnalysis::plotSimExpComp | ( | DetType | a_detType, |
| int | a_detID, | ||
| int | a_elemID = 0, |
||
| bool | a_addBack = false |
||
| ) |
plot simulated and experimental efficiency + percent difference

◆ processSimulatedData()
| void GammaEfficiencyAnalysis::processSimulatedData | ( | string | a_configFileName, |
| bool | a_resampleEffCorr = false, |
||
| double | a_acceptanceWindow = 2.5e-3 |
||
| ) |
create simulated histograms if trigger probability data has been added, these are applied, if not, trigger probability = 1
for TF int-diff sampling
loop over entries for tf int diff propagation
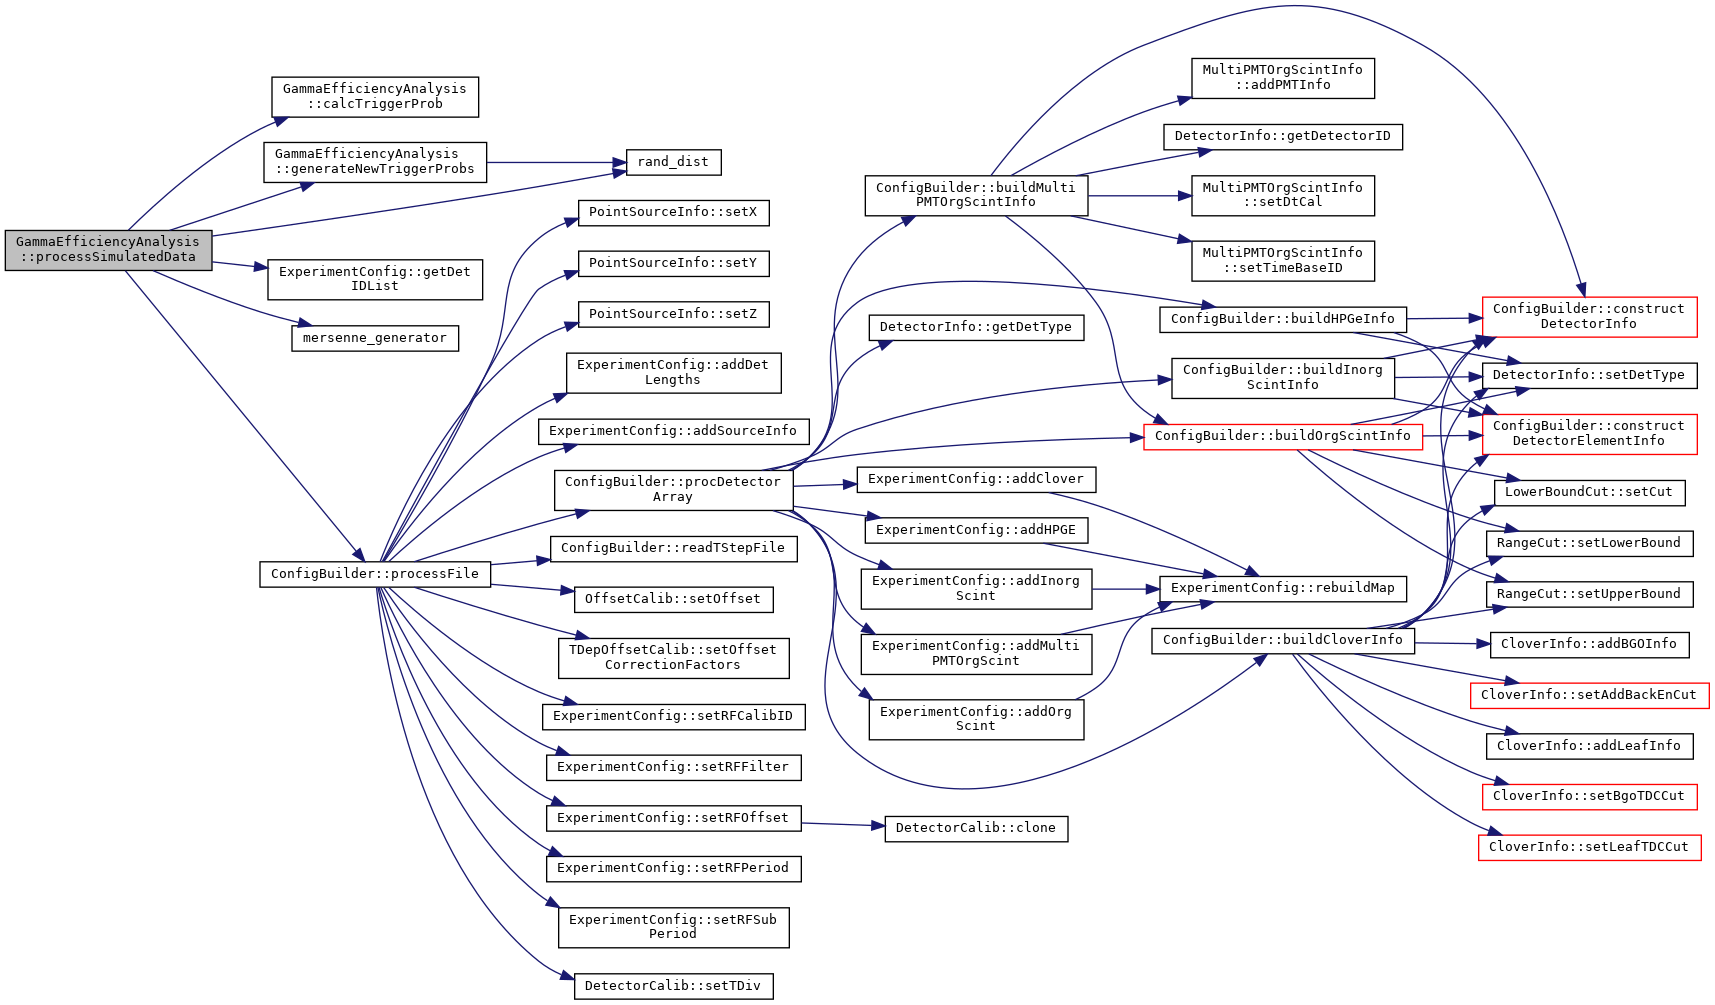
◆ setNewPeakFit()
| void GammaEfficiencyAnalysis::setNewPeakFit | ( | PeakInfo | a_peakInfo, |
| DetType | a_detType, | ||
| int | a_detID, | ||
| int | a_elemID = 0, |
||
| bool | a_addBack = false |
||
| ) |

◆ setSimHistMaxE()
| void GammaEfficiencyAnalysis::setSimHistMaxE | ( | double | a_maxEnergy | ) |
set maximum energy for simulated hists - should be the max energy at which the simulation was run
◆ setSimHistNumBins()
| void GammaEfficiencyAnalysis::setSimHistNumBins | ( | int | a_bins | ) |
set number of bins for simulated hists
◆ setVerbosity()
| void GammaEfficiencyAnalysis::setVerbosity | ( | int | a_verbosity | ) |

◆ uniEffComp()
| map< double, vector< double > > GammaEfficiencyAnalysis::uniEffComp | ( | int | a_channel, |
| string | a_dl = "p0", |
||
| string | a_loc = "center2", |
||
| bool | a_draw = 0 |
||
| ) |
plot simulated and experimental efficiency + percent difference
load the experimental data - should probably store the fits so they aren't redone every time
load the simulated spectra
average simulated over 4 bins
compute trigger prob at each bin center
computer unc. from trigger prob using unc. on fit parameters
or just call that uncertainty 1%
average over 4 bins again
standard efficiency fit function
for average percent diff and std. dev, only look above 400 keV

◆ useTFIntDiffCorrection() [1/2]
| void GammaEfficiencyAnalysis::useTFIntDiffCorrection | ( | bool | a_useCorr | ) |
◆ useTFIntDiffCorrection() [2/2]
| void GammaEfficiencyAnalysis::useTFIntDiffCorrection | ( | bool | a_useCorr | ) |
Member Data Documentation
◆ m_angEffHists
| map<DetType, map<int, map<int, TH2F*> > > GammaEfficiencyAnalysis::m_angEffHists |
◆ m_corrParamsD
| map<DetType, map<int, map<int, Eigen::VectorXf> > > GammaEfficiencyAnalysis::m_corrParamsD |
◆ m_corrParamsD0
| map<DetType, map<int, map<int, Eigen::VectorXf> > > GammaEfficiencyAnalysis::m_corrParamsD0 |
◆ m_corrParamsDCov
| map<DetType, map<int, map<int, Eigen::MatrixXf> > > GammaEfficiencyAnalysis::m_corrParamsDCov |
◆ m_gammaEnergies
| vector<double> GammaEfficiencyAnalysis::m_gammaEnergies |
◆ m_lastPeakFits
| map<double, PeakInfo> GammaEfficiencyAnalysis::m_lastPeakFits |
The documentation for this class was generated from the following files:
- analysis/include/GammaEfficiencyAnalysis.h
- analysis/src/GammaEfficiencyAnalysis.cpp